RSI Divergence[UgurTash] – Real-Time📈 RSI Divergence – Real-Time, Adaptive, and Intelligent RSI Divergence Detection
🚀 What Does This Indicator Do?
RSI Divergence is a real-time divergence detection tool that helps traders identify bullish and bearish divergences between price and the Relative Strength Index (RSI). Unlike traditional RSI-based indicators, this script offers:
✅ Real-time detection – No need to wait for bar closes or repainting.
✅ Dynamic time-frame adaptation – The script automatically adjusts RSI settings based on the selected chart time frame.
✅ Multi-layered divergence analysis – Supports short-term, medium-term, and long-term divergence detection with an optional all-term mode that dynamically selects the best configuration.
🛠 How Does It Work?
Pivot-Based Divergence Detection:
The script analyzes pivot points on both price and RSI to determine valid divergences.
Bullish divergence occurs when price forms a lower low but RSI trends higher, indicating potential upward momentum.
Bearish divergence occurs when price forms a higher high but RSI trends lower, signaling possible weakness.
Adaptive RSI Calculation:
The RSI length is dynamically adjusted based on the chosen time frame:
Short-Term: RSI (7) for 1-5 min charts.
Medium-Term: RSI (14) for 15-60 min charts.
Long-Term: RSI (28) for 4H+ charts.
In All-Term Mode, the script automatically determines the best RSI length based on the active chart timeframe.
Smart Visualization & Alerts:
Bullish divergences are marked with green lines & labels.
Bearish divergences are highlighted in red.
Users can customize symbol size, divergence labels, and colors.
Instant alerts notify traders as soon as a divergence is detected.
🎯 How to Use This Indicator?
📌 For Trend Reversals: Look for bullish divergences at key support levels and bearish divergences at resistance zones.
📌 For Trend Continuation: Combine divergence signals with moving averages, volume analysis, or price action strategies to confirm trades.
📌 For Scalping & Swing Trading: Adjust the time-frame settings to match your trading style.
🏆 What Makes This Indicator Original?
🔹 Unlike standard RSI divergence indicators, this script features real-time analysis with no repainting, allowing for instant trading decisions.
🔹 The time-frame adaptive RSI makes it dynamic and suitable for any market condition.
🔹 The multi-term divergence detection offers flexibility, giving traders a precise view of both short-term & long-term market structure.
⚠ Note: No indicator guarantees 100% accuracy. Always use additional confirmations and sound risk management strategies.
If you find this tool useful, don’t forget to support & share! 🚀
Cerca negli script per "Relative Strength Index (RSI) "

Normalized RSI Oscillator with DivergencesNormalized RSI with Divergences {A Next-Level Trading Tool}
The Normalized RSI with Divergences indicator is a powerful and innovative tool designed to enhance your trading precision. By normalizing the Relative Strength Index (RSI) and detecting divergences between the standard and normalized RSI, this script helps traders identify potential trend reversals and continuations with remarkable clarity.
Key Features
🔹 Advanced RSI Normalization
• Transforms the traditional RSI into a normalized range of , making overbought and oversold conditions more intuitive.
• Utilizes a dynamic lookback period to adapt to market conditions.
🔹 Divergence Detection for Smarter Trading
• Identifies Bullish, Hidden Bullish, Bearish, and Hidden Bearish divergences by analyzing RSI pivot points.
• Provides early signals of trend reversals and continuations for better trade execution.
🔹 Clear & Visual Trade Signals
• Divergences are automatically labeled on the chart:
o Bullish Divergence: 🟢 “Bull” (Green) – Possible upward reversal.
o Hidden Bullish Divergence: 🟢 “Hid.” (Lime) – Continuation of an uptrend.
o Bearish Divergence: 🔴 “Bear” (Red) – Possible downward reversal.
o Hidden Bearish Divergence: 🟠 “Hid.” (Orange) – Continuation of a downtrend.
🔹 Fully Customizable Inputs
• Adjust RSI period, normalization lookback, and divergence parameters to fit your strategy.
• Tailor the indicator to your preferred trading style and market conditions.
________________________________________
How It Works
🔹 RSI Normalization Formula:
Norm=2×(RSI−MinMax−Min)−1\text{Norm} = 2 \times \left(\frac{\text{RSI} - \text{Min}}{\text{Max} - \text{Min}}\right) - 1Norm=2×(Max−MinRSI−Min)−1
• Min & Max represent the lowest and highest RSI values over the selected lookback period.
🔹 Divergence Detection Process:
• Identifies pivot points in both the normalized RSI and the standard RSI.
• Compares their directions to detect potential trading signals.
🔹 Real-Time Chart Labeling:
• Uses label.new to visually highlight divergence points for quick and efficient decision-making.
________________________________________
Input Parameters
• Source: Price source for RSI calculation (Default: hlc3).
• Signal Period: RSI calculation period (Default: 50).
• Lookback Range: Normalization period (Default: 200, Max: 5000).
• Trend Length: Smoothing period for normalized RSI (Default: 5).
• Band Width: Center line & bands calculation period (Default: 34).
• Divergence Range: Lookback period for divergence detection (Default: 5).
________________________________________
How to Use
1. Add the script to your trading chart.
2. Customize the settings to match your trading approach.
3. Watch for divergence labels to identify potential market moves:
o 🟢 Bullish Divergence: Possible upward reversal.
o 🟢 Hidden Bullish Divergence: Continuation of an uptrend.
o 🔴 Bearish Divergence: Possible downward reversal.
o 🟠 Hidden Bearish Divergence: Continuation of a downtrend.
________________________________________
Why Use This Indicator?
✅ Enhanced RSI Analysis: Normalization simplifies overbought/oversold conditions.
✅ Crystal-Clear Divergence Signals: Instantly spot key trend shifts.
✅ Fully Customizable: Adjust settings for your specific strategy.
✅ Improve Trade Accuracy: Gain an edge with precise divergence detection.
________________________________________
⚠️ Disclaimer
This script is for educational and informational purposes only. It does not constitute financial advice. Always conduct thorough research and backtesting before using it in live trading.
📜 License
This script is released under the Mozilla Public License 2.0.
Enjoy the Normalized RSI with Divergences indicator, and happy trading! 🚀📈
— Kerem Ertem

Volatility Arbitrage Spread Oscillator Model (VASOM)The Volatility Arbitrage Spread Oscillator Model (VASOM) is a systematic approach to capitalizing on price inefficiencies in the VIX futures term structure. By analyzing the differential between front-month and second-month VIX futures contracts, we employ a momentum-based oscillator (Relative Strength Index, RSI) to signal potential market reversion opportunities. Our research builds upon existing financial literature on volatility risk premia and contango/backwardation dynamics in the volatility markets (Zhang & Zhu, 2006; Alexander & Korovilas, 2012).
Volatility derivatives have become essential tools for managing risk and engaging in speculative trades (Whaley, 2009). The Chicago Board Options Exchange (CBOE) Volatility Index (VIX) measures the market’s expectation of 30-day forward-looking volatility derived from S&P 500 option prices (CBOE, 2018). Term structures in VIX futures often exhibit contango or backwardation, depending on macroeconomic and market conditions (Alexander & Korovilas, 2012).
This strategy seeks to exploit the spread between the front-month and second-month VIX futures as a proxy for term structure dynamics. The spread’s momentum, quantified by the RSI, serves as a signal for entry and exit points, aligning with empirical findings on mean reversion in volatility markets (Zhang & Zhu, 2006).
• Entry Signal: When RSI_t falls below the user-defined threshold (e.g., 30), indicating a potential undervaluation in the spread.
• Exit Signal: When RSI_t exceeds a threshold (e.g., 70), suggesting mean reversion has occurred.
Empirical Justification
The strategy aligns with findings that suggest predictable patterns in volatility futures spreads (Alexander & Korovilas, 2012). Furthermore, the use of RSI leverages insights from momentum-based trading models, which have demonstrated efficacy in various asset classes, including commodities and derivatives (Jegadeesh & Titman, 1993).
References
• Alexander, C., & Korovilas, D. (2012). The Hazards of Volatility Investing. Journal of Alternative Investments, 15(2), 92-104.
• CBOE. (2018). The VIX White Paper. Chicago Board Options Exchange.
• Jegadeesh, N., & Titman, S. (1993). Returns to Buying Winners and Selling Losers: Implications for Stock Market Efficiency. The Journal of Finance, 48(1), 65-91.
• Zhang, C., & Zhu, Y. (2006). Exploiting Predictability in Volatility Futures Spreads. Financial Analysts Journal, 62(6), 62-72.
• Whaley, R. E. (2009). Understanding the VIX. The Journal of Portfolio Management, 35(3), 98-105.

Waldo's RSI Color Trend Candles
TradingView Description for Waldo's RSI Color Trend Candles
Title: Waldo's RSI Color Trend Candles
Short Title: Waldo RSI CTC
Overview:
Waldo's RSI Color Trend Candles is a visually intuitive indicator designed to enhance your trading experience by color-coding candlesticks based on the integration of Relative Strength Index (RSI) momentum and moving average trend analysis. This innovative tool overlays directly on your price chart, providing a clear, color-based representation of market sentiment and trend direction.
What is it?
This indicator combines the power of RSI with the simplicity of moving averages to offer traders a unique way to visualize market conditions:
RSI Integration: The RSI is computed with customizable parameters, allowing traders to adjust how momentum is interpreted. The RSI values influence the primary color of the candles, indicating overbought or oversold market states.
Moving Averages: Utilizing two Simple Moving Averages (SMAs) with user-defined lengths, the indicator helps in identifying trend directions through their crossovers. The fast MA and slow MA can be toggled on/off for visual clarity.
Color Trend Candles: The 'Color Trend Candles' feature uses a dynamic color scheme to reflect different market conditions:
Purple for overbought conditions when RSI exceeds the set threshold (default 70).
Blue for oversold conditions when RSI falls below the set threshold (default 44).
Green indicates a bullish trend, confirmed by both price action and RSI being bullish (fast MA crossing above slow MA, with price above the slow MA).
Red signals a bearish trend, when both price and RSI are bearish (fast MA crossing below slow MA, with price below the slow MA).
Gray for neutral or mixed market sentiment, where signals are less clear or contradictory.
How to Use It:
Waldo's RSI Color Trend Candles is tailored for traders who appreciate visual cues in their trading strategy:
Trend and Momentum Insight: The color of each candle gives an immediate visual representation of both the trend (via MA crossovers) and momentum (via RSI). Green and red candles align with bullish or bearish trends, respectively, providing a quick reference for market direction.
Identifying Extreme Conditions: Purple and blue candles highlight potential reversal zones or areas where the market might be overstretched, offering opportunities for contrarian trades or to anticipate market corrections.
Customization: Users can adjust the RSI length, overbought/oversold levels, and the lengths of the moving averages to align with their trading style or the specific characteristics of the asset they're trading.
This customization ensures the indicator can be tailored to various market conditions.
Simplified Decision Making: Designed for traders who prefer a visual approach, this indicator simplifies the decision-making process by encoding complex market data into an easy-to-understand color system.
However, for a robust trading strategy, it's recommended to use it alongside other analytical tools.
Control Over Display: The option to show or hide moving averages and to enable or disable the color-coding of candles provides users with control over how information is presented, allowing for a cleaner chart or more detailed analysis as preferred.
Conclusion:
Waldo's RSI Color Trend Candles offers a fresh, visually appealing method to interpret market trends and momentum through the color of candlesticks. It's ideal for traders looking for a straightforward way to gauge market sentiment at a glance. While this indicator can significantly enhance your trading setup, remember to incorporate it within a broader strategy, using additional confirmation from other indicators or analysis methods to manage risk and validate trading decisions. Dive into the colorful world of trading with Waldo's RSI Color Trend Candles and let the market's mood guide your trades with clarity and ease.

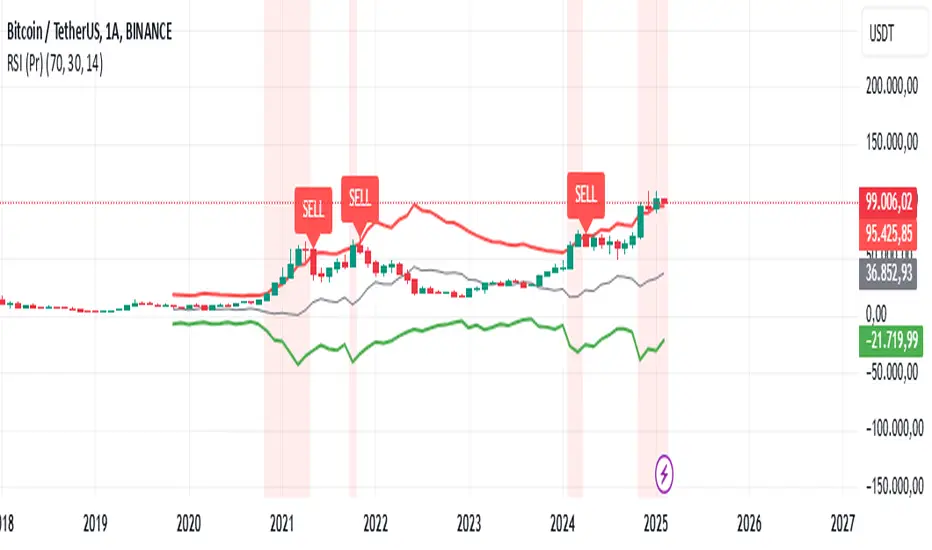
RSI (Pr)The "RSI (Pr)" indicator enhances the traditional Relative Strength Index (RSI) by incorporating dynamic bands and highlighting extreme market conditions directly on the price chart. This approach offers traders a more intuitive visualization of potential overbought and oversold zones, facilitating timely decision-making.
Key Features:
Dynamic RSI Bands: The indicator calculates upper and lower bands based on user-defined overbought and oversold levels. These bands adjust in real-time, providing a responsive measure of market extremes.
Visual Alerts: Background colors change when the price moves outside the RSI bands, offering immediate visual cues of potential market reversals.
Buy/Sell Signals: The script places "BUY" and "SELL" labels on the chart when the price crosses above or below the RSI bands, assisting traders in identifying potential entry and exit points.
How It Works:
RSI Calculation: The script computes the RSI based on the closing price and a user-defined length (default is 14 periods).
Exponential Moving Averages (EMA): It calculates the EMA of the maximum gains and losses to smooth out the data, enhancing the reliability of the RSI bands.
Upper and Lower Bands: Using the smoothed data, the script determines the upper (resistance) and lower (support) bands, which represent dynamic overbought and oversold levels.
Visual Indicators: The script plots the upper and lower bands, as well as a midline, directly on the price chart. Background colors change when the price exceeds these bands, and "BUY" or "SELL" labels appear at crossover points.
Usage:
Overbought Conditions: When the price crosses above the upper band, it may indicate an overbought condition, suggesting a potential selling opportunity.
Oversold Conditions: When the price crosses below the lower band, it may indicate an oversold condition, suggesting a potential buying opportunity.
Customization:
Users can adjust the following parameters to suit their trading preferences:
RSI Overbought Level: Default is 70.
RSI Oversold Level: Default is 30.
RSI Length: Default is 14 periods.
Disclaimer:
This indicator is designed for educational purposes and should not be construed as financial advice. Trading involves significant risk, and it's essential to conduct thorough research and consider your financial situation before making trading decisions. Past performance is not indicative of future results.
By integrating dynamic RSI bands and clear visual signals directly onto the price chart, this indicator aims to provide traders with actionable insights into market conditions, enhancing the traditional RSI analysis.
RSI OB/OS Strategy Analyzer█ OVERVIEW
The RSI OB/OS Strategy Analyzer is a comprehensive trading tool designed to help traders identify and evaluate overbought/oversold reversal opportunities using the Relative Strength Index (RSI). It provides visual signals, performance metrics, and a detailed table to analyze the effectiveness of RSI-based strategies over a user-defined lookback period.
█ KEY FEATURES
RSI Calculation
Calculates RSI with customizable period (default 14)
Plots dynamic overbought (70) and oversold (30) levels
Adds background coloring for OB/OS regions
Reversal Signals
Identifies signals based on RSI crossing OB/OS levels
Two entry strategies available:
Revert Cross: Triggers when RSI exits OB/OS zone
Cross Threshold: Triggers when RSI enters OB/OS zone
Trade Direction
Users can select a trade bias:
Long: Focuses on oversold reversals (bullish signals)
Short: Focuses on overbought reversals (bearish signals)
Performance Metrics
Calculates three key statistics for each lookback period:
Win Rate: Percentage of profitable trades
Mean Return: Average return across all trades
Median Return: Median return across all trades
Metrics calculated as percentage changes from entry price
Visual Signals
Dual-layer signal display:
BUY: Green triangles + text labels below price
SELL: Red triangles + text labels above price
Semi-transparent background highlighting in OB/OS zones
Performance Table
Interactive table showing metrics for each lookback period
Color-coded visualization:
Win Rate: Gradient from red (low) to green (high)
Returns: Green for positive, red for negative
Time Filtering
Users can define a specific time window for the indicator to analyze trades, ensuring that performance metrics are calculated only for the desired period.
Customizable Display
Adjustable table font sizes: Auto/Small/Normal/Large
Toggle option for table visibility
█ PURPOSE
The RSI OB/OS Strategy Analyzer helps traders:
Identify mean-reversion opportunities through RSI extremes
Backtest entry strategy effectiveness across multiple time horizons
Optimize trade timing through visual historical performance data
Quickly assess strategy robustness with color-coded metrics
█ IDEAL USERS
Counter-Trend Traders: Looking to capitalize on RSI extremes
Systematic Traders: Needing quantitative strategy validation
Educational Users: Studying RSI behavior in different market conditions
Multi-Timeframe Analysts: Interested in forward returns analysis

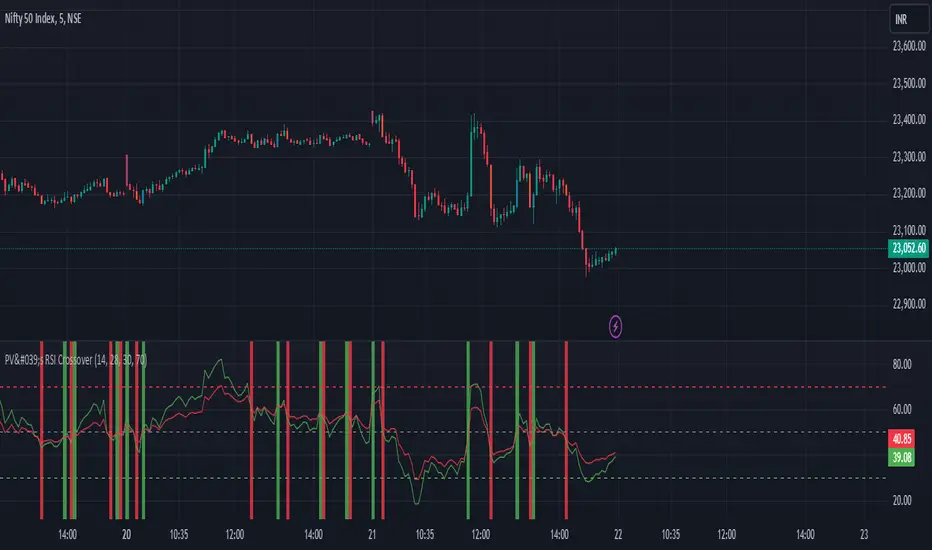
PV's Dual RSI Crossover StrategyIntroduction to the Dual RSI Two-Cross Indicator
The Relative Strength Index (RSI) is a widely used technical indicator in finance that measures the magnitude of recent price changes to determine overbought or oversold conditions. The RSI Two-Cross indicator takes this concept a step further by introducing a unique twist: it plots two RSI lines with different lengths and generates alerts based on their crossovers.
Key Features:
Dual RSI Lines: The indicator plots two RSI lines with user-defined lengths, allowing traders to compare the short-term and long-term momentum of an asset.
Crossover Alerts: The indicator generates alerts when the shorter RSI line crosses above or below the longer RSI line, indicating potential trend reversals or continuations.
Customizable Parameters: Users can adjust the lengths of the RSI lines, oversold and overbought levels, and other parameters to suit their trading strategy and asset of choice.
Visual Aids: The indicator features colored bars and backgrounds to highlight crossover events, making it easy to identify trading opportunities at a glance.
Trading Applications:
Trend Reversal Detection: The RSI Two-Cross indicator can help traders identify potential trend reversals by monitoring crossovers between the two RSI lines.
Momentum Confirmation: The indicator can be used to confirm momentum shifts in an asset's price, helping traders to filter out false signals and make more informed trading decisions.
Scalping and Day Trading: The indicator's short-term focus makes it suitable for scalping and day trading strategies, where traders aim to capitalize on small price movements.
By combining the versatility of the RSI with the power of crossover analysis, the RSI Two-Cross indicator offers a unique perspective on market momentum and trend dynamics. Whether you're a seasoned trader or just starting out, this indicator can help you navigate the markets with greater confidence and precision.
Volume-Based RSI Color Indicator with MAsVolume-Based RSI Color Indicator with MAs
Overview
This script combines the Relative Strength Index (RSI) with volume analysis to provide an enhanced perspective on market conditions. By dynamically coloring the RSI line based on overbought/oversold conditions and volume thresholds, this indicator helps traders quickly identify high-probability reversal zones. Additionally, it incorporates short-term and long-term moving averages (MAs) of the RSI for trend analysis, making it a versatile tool for scalping and swing trading strategies.
Key Features
Dynamic RSI Color Coding:
The RSI line changes color based on two conditions:
Overbought/High Volume: RSI is above the overbought threshold (default: 70) and volume exceeds the average volume by a user-defined multiplier (default: 2.0). The line turns red, indicating potential reversal zones.
Oversold/High Volume: RSI is below the oversold threshold (default: 30) and volume exceeds the average volume by the multiplier. The line turns green, suggesting potential buying opportunities.
Neutral Conditions: Default blue color for all other scenarios.
Volume Integration:
Unlike standard RSI indicators, this script incorporates volume data to refine signals, helping traders avoid false signals in low-volume environments.
RSI Moving Averages:
Two moving averages of the RSI (short-term and long-term) provide trend context:
200-period MA: Highlights the long-term trend in RSI values.
20-period MA: Shows short-term fluctuations for quick decision-making.
Both MAs can be calculated using Simple or Exponential methods, giving users flexibility.
Visual Aids:
Horizontal lines at the overbought (70) and oversold (30) levels help define the boundaries of expected price action extremes.
How It Works
The script calculates the RSI over a user-defined length (default: 14).
Volume data is compared to its moving average to determine if it exceeds the user-defined high-volume threshold.
When RSI and volume conditions align, the RSI line is dynamically colored to indicate potential overbought/oversold zones.
The RSI moving averages provide additional context to confirm trends or reversals.
How to Use
Identify Reversal Zones:
Look for green RSI signals in oversold conditions to identify potential buying opportunities.
Look for red RSI signals in overbought conditions to identify potential selling opportunities.
Use Moving Averages for Confirmation:
When the RSI is above its 200-period MA, the long-term trend is bullish; consider only long trades.
When the RSI is below its 200-period MA, the trend is bearish; consider only short trades.
Combine with Other Tools:
This indicator works best when used alongside price action analysis, candlestick patterns, or support/resistance levels.
Originality
This script is unique in combining volume analysis with RSI and RSI-specific moving averages. While many indicators focus on RSI or volume separately, this script marries these two key metrics to filter out weak signals and improve trade decision accuracy.
Chart Recommendations
Clean Chart: Use this indicator on a clean chart without additional overlays for maximum clarity.
Timeframes: Works well on intraday charts (e.g., 5m, 15m) for scalping and on higher timeframes (e.g., 1H, 4H, Daily) for swing trading.
Disclaimer
This indicator is a tool to aid trading decisions and should not be used in isolation. Always consider other factors such as market conditions, news events, and risk management.

GOLDEN RSI by @thejamiulGOLDEN RSI thejamiul is a versatile Relative Strength Index (RSI)-based tool designed to provide enhanced visualization and additional insights into market trends and potential reversal points. This indicator improves upon the traditional RSI by integrating gradient fills for overbought/oversold zones and divergence detection features, making it an excellent choice for traders who seek precise and actionable signals.
Source of this indicator : This indicator is based on @TradingView original RSI indicator with a little bit of customisation to enhance overbought and oversold identification.
Key Features
1. Customizable RSI Settings:
RSI Length: Adjust the RSI calculation period to suit your trading style (default: 14).
Source Selection: Choose the price source (e.g., close, open, high, low) for RSI calculation.
2. Gradient-Filled RSI Zones:
Overbought Zone (80-100): Gradient fill with shades of green to indicate strong bullish conditions.
Oversold Zone (0-20): Gradient fill with shades of red to highlight strong bearish conditions.
3. Support and Resistance Levels:
Upper Band: 80
Middle Bands: 60 (bullish) and 40 (bearish)
Lower Band: 20
These levels help identify overbought, oversold, and neutral zones.
4. Divergence Detection:
Bullish Divergence: Detects lower lows in price with corresponding higher lows in RSI, signaling potential upward reversals.
Bearish Divergence: Detects higher highs in price with corresponding lower highs in RSI, indicating potential downward reversals.
Visual Indicators:
Bullish divergence is marked with green labels and line plots.
Bearish divergence is marked with red labels and line plots.
5. Alert Functionality:
Custom Alerts: Set up alerts for bullish or bearish divergences to stay notified of potential trading opportunities without constant chart monitoring.
6. Enhanced Chart Visualization:
RSI Plot: A smooth and visually appealing RSI curve.
Color Coding: Gradient and fills for better distinction of trading zones.
Pivot Labels: Clear identification of divergence points on the RSI plot.

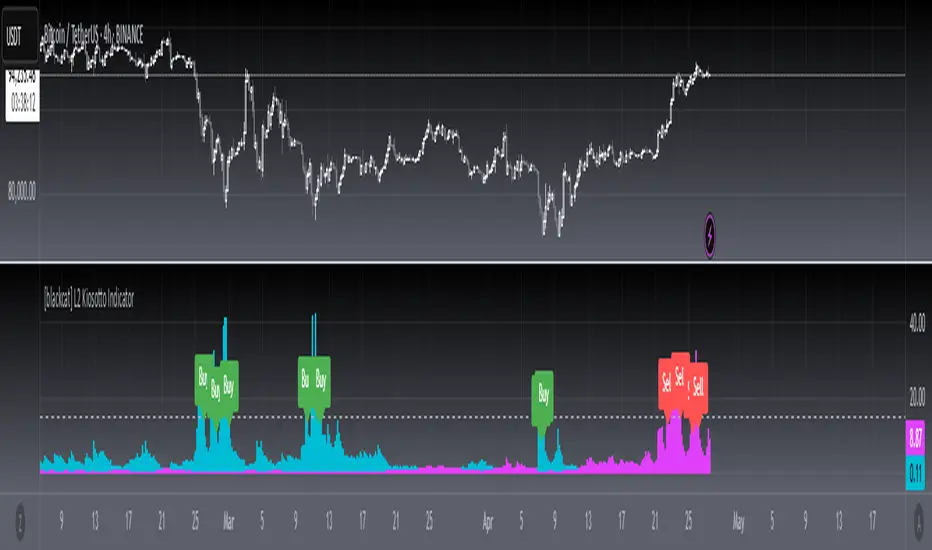
[blackcat] L2 Kiosotto IndicatorOVERVIEW
The Kiosotto Indicator is a versatile technical analysis tool designed for forex trading but applicable to other financial markets. It excels in detecting market reversals and trends without repainting, ensuring consistent and reliable signals. The indicator has evolved over time, with different versions focusing on specific aspects of market analysis.
KEY FEATURES
Reversal Detection: Identifies potential market reversals, crucial for traders looking to capitalize on turning points.
Trend Detection: Earlier versions focused on detecting trends, useful for traders who prefer to follow the market direction.
Non-Repainting: Signals remain consistent on the chart, providing reliable and consistent signals.
Normalization: Later versions, such as Normalized Kiosotto and Kiosotto_2025, incorporate normalization to assess oversold and overbought conditions, enhancing interpretability.
VERSIONS AND EVOLUTION
Early Versions: Focused on trend detection, useful for following market direction.
2 in 1 Kiosotto: Emphasizes reversal detection and is considered an improvement by users.
Normalized Versions (e.g., Kiosotto_2025, Kiosotto_3_2025): Introduce normalization to assess oversold and overbought conditions, enhancing interpretability.
HOW TO USE THE KIOSOTTO INDICATOR
Understanding Signals:
Reversals: Look for the indicator's signals that suggest a potential reversal, indicated by color changes, line crossings, or other visual cues.
Trends: Earlier versions might show stronger trending signals, indicated by the direction or slope of the indicator's lines.
Normalization Interpretation (for normalized versions):
Oversold: When the indicator hits the lower boundary, it might indicate an oversold condition, suggesting a potential buy signal.
Overbought: Hitting the upper boundary could signal an overbought condition, suggesting a potential sell signal.
PINE SCRIPT IMPLEMENTATION
The provided Pine Script code is a version of the Kiosotto indicator. Here's a detailed explanation of the code:
//@version=5
indicator(" L2 Kiosotto Indicator", overlay=false)
//Pine version of Kiosotto 2015 v4 Alert ms-nrp
// Input parameters
dev_period = input.int(150, "Dev Period")
alerts_level = input.float(15, "Alerts Level")
tsbul = 0.0
tsber = 0.0
hpres = 0.0
lpres = 9999999.0
for i = 0 to dev_period - 1
rsi = ta.rsi(close , dev_period)
if high > hpres
hpres := high
tsbul := tsbul + rsi * close
if low < lpres
lpres := low
tsber := tsber + rsi * close
buffer1 = tsber != 0 ? tsbul / tsber : 0
buffer2 = tsbul != 0 ? tsber / tsbul : 0
// Plotting
plot(buffer1, color=color.aqua, linewidth=3, style=plot.style_histogram)
plot(buffer2, color=color.fuchsia, linewidth=3, style=plot.style_histogram)
hline(alerts_level, color=color.silver)
EXPLANATION OF THE CODE
Indicator Definition:
indicator(" L2 Kiosotto Indicator", overlay=false): Defines the indicator with the name " L2 Kiosotto Indicator" and specifies that it should not be overlaid on the price chart.
Input Parameters:
dev_period = input.int(150, "Dev Period"): Allows users to set the period for the deviation calculation.
alerts_level = input.float(15, "Alerts Level"): Allows users to set the level for alerts.
Initialization:
tsbul = 0.0: Initializes the tsbul variable to 0.0.
tsber = 0.0: Initializes the tsber variable to 0.0.
hpres = 0.0: Initializes the hpres variable to 0.0.
lpres = 9999999.0: Initializes the lpres variable to a very high value.
Loop for Calculation:
The for loop iterates over the last dev_period bars.
rsi = ta.rsi(close , dev_period): Calculates the RSI for the current bar.
if high > hpres: If the high price of the current bar is greater than hpres, update hpres and add the product of RSI and close price to tsbul.
if low < lpres: If the low price of the current bar is less than lpres, update lpres and add the product of RSI and close price to tsber.
Buffer Calculation:
buffer1 = tsber != 0 ? tsbul / tsber : 0: Calculates the first buffer as the ratio of tsbul to tsber if tsber is not zero.
buffer2 = tsbul != 0 ? tsber / tsbul : 0: Calculates the second buffer as the ratio of tsber to tsbul if tsbul is not zero.
Plotting:
plot(buffer1, color=color.aqua, linewidth=3, style=plot.style_histogram): Plots the first buffer as a histogram with an aqua color.
plot(buffer2, color=color.fuchsia, linewidth=3, style=plot.style_histogram): Plots the second buffer as a histogram with a fuchsia color.
hline(alerts_level, color=color.silver): Draws a horizontal line at the alerts_level with a silver color.
FUNCTIONALITY
The Kiosotto indicator calculates two buffers based on the RSI and price levels over a specified period. The buffers are plotted as histograms, and a horizontal line is drawn at the alerts level. The indicator helps traders identify potential reversals and trends by analyzing the relationship between the RSI and price levels.
ALGORITHMS
RSI Calculation:
The Relative Strength Index (RSI) measures the speed and change of price movements. It is calculated using the formula:
RSI=100− (1+RS) / 100
where RS is the ratio of the average gain to the average loss over the specified period.
Buffer Calculation:
The buffers are calculated as the ratio of the sum of RSI multiplied by the close price for high and low price conditions. This helps in identifying the balance between buying and selling pressure.
Signal Generation:
The indicator generates signals based on the values of the buffers and the alerts level. Traders can use these signals to make informed trading decisions, such as entering or exiting trades based on potential reversals or trends.
APPLICATION SCENARIOS
Reversal Trading: Traders can use the Kiosotto indicator to identify potential reversals by looking for significant changes in the buffer values or crossings of the alerts level.
Trend Following: The indicator can also be used to follow trends by analyzing the direction and slope of the buffer lines.
Oversold/Overbought Conditions: For normalized versions, traders can use the indicator to identify oversold and overbought conditions, which can provide buy or sell signals.
THANKS
Special thanks to the TradingView community and the original developers for their contributions and support in creating and refining the Kiosotto Indicator.
rsi wf breakoutRSI Breakout Asif
RSI Breakout Asif Indicator
Overview:
The RSI Breakout Asif indicator is a custom script designed to analyze and highlight potential
breakout points using the Relative Strength Index (RSI) combined with Williams Fractals. This
indicator is specifically developed for traders who want to identify key momentum shifts in the
market.
Features:
1. RSI Analysis:
- The RSI is calculated using a user-defined length and price source.
- Horizontal lines are plotted at levels 70 (overbought), 50 (neutral), and 30 (oversold) to visually
aid decision-making.
2. Williams Fractals on RSI:
- Detects fractal highs and lows based on RSI values.
- Highlights these fractal points with dynamic, symmetrical lines for better visibility.
3. Customization:
- Users can adjust the RSI length and price source for personalized analysis.
- Fractal settings (left and right bar length) are also adjustable, making the indicator versatile for
different trading styles.
4. Visual Enhancements:
- Fractal highs are marked in red, while fractal lows are marked in green.
Asif - Page 1
RSI Breakout Asif
- Precise line placement ensures clarity and reduces chart clutter.
5. Practical Utility:
- Use the fractal breakout signals in conjunction with other technical indicators for enhanced
decision-making.
Usage:
- Add the RSI Breakout Asif indicator to your TradingView chart.
- Adjust the settings according to your trading strategy.
- Observe the RSI values and fractal points to identify potential breakout zones.
Disclaimer:
This indicator is a technical analysis tool and should be used in combination with other analysis
methods. It does not guarantee profitable trades.
Watermarked by Asif.
Asif - Page 2

Smooth RSI [MarktQuant]This indicator combines elements of the Relative Strength Index (RSI) and Rate of Change (RoC) to provide a smoother and potentially more insightful view of market momentum and price movement. The Smooth RSI calculates RSI values across four price points (high, open, low, close) to average them, offering a less volatile RSI signal. Additionally, it incorporates a Rate of Change for trend confirmation, enhancing the decision-making process for trade entries and exits.
Features:
Multi-RSI Calculation: RSI is computed for high, open, low, and close prices, then averaged to reduce noise.
Trend Confirmation with RoC: Uses the Rate of Change to validate the RSI signals, coloring bars based on the trend direction.
Visual Signals:
Bar colors change based on combined RSI and RoC signals.
Green for bullish signals (RSI above 50 and positive RoC).
Red for bearish signals (RSI below 50 and negative RoC).
Horizontal lines at 30, 50, and 70 to denote overbought, neutral, and oversold conditions.
Customizable Display:
Option to show/hide RSI plot or RoC plot for cleaner charts.
Candle plot overlay option to visualize current price action alongside the indicator.
Inputs:
RSI Length: Default 28. Adjusts the lookback period for RSI calculation.
RoC Length: Default 28. Sets the period for the Rate of Change calculation.
Plot Settings:
Show RSI - Toggle RSI plot visibility.
Show RoC - Toggle RoC plot visibility.
Usage:
Long signals are indicated when the average RSI is above 50 and the RoC is positive.
Short signals are suggested when the average RSI falls below 50 with a negative RoC.
The color coding helps visually confirm trends at a glance.
Notes:
This indicator is best used in conjunction with other analysis methods to confirm signals.
Adjust the length parameters based on your trading timeframe for optimal results.
Disclaimer:
This indicator does not guarantee trading success; use it as part of a comprehensive trading strategy. Always conduct your own analysis before making trading decisions.
RSI-Adjusted 9SMAThis indicator integrates the Relative Strength Index (RSI) and a Simple Moving Average (SMA) to create a more robust trading signal by blending momentum and trend analysis. Here's how they work together:
How the RSI and SMA Work in Harmony
RSI (Momentum Indicator):
The RSI measures the speed and change of price movements, oscillating between 0 and 100.
Typically, an RSI value above 50 suggests bullish momentum, while values below 50 indicate bearish momentum.
The script further refines this by applying a 9-period EMA to the RSI. This smoothing process filters out noise, providing a clearer picture of momentum shifts.
SMA (Trend Indicator):
The SMA calculates the average price over a specific period (9 in this case), helping to smooth out price fluctuations and identify the overall trend.
By observing the SMA, traders can determine whether the market is trending upward, downward, or moving sideways.
Combining the Two for Stronger Signals:
The RSI EMA acts as a momentum filter. When it is above 50, it indicates the presence of bullish momentum. Under such conditions, the SMA turning blue provides a stronger confirmation of an uptrend.
Conversely, when the RSI EMA is below 50, it signals weakening momentum. The SMA turning white underlines the caution, suggesting potential bearish conditions or a lack of trend strength.
This combination ensures that traders are not just relying on the SMA's trend-following behavior but also factoring in the market's underlying momentum for more reliable entries and exits.
Why This Approach is Robust
Avoid False Signals:
The SMA alone can generate false signals in choppy or range-bound markets. By incorporating the RSI EMA, the script reduces the likelihood of acting on weak or non-committal trends.
Timing Entries and Exits:
When both the SMA and RSI EMA align (e.g., blue SMA and RSI EMA > 50), it provides a stronger case for entering trades. Similarly, misalignment (e.g., white SMA and RSI EMA ≤ 50) warns against entering during uncertain conditions.
Adapting to Market Conditions:
This dual approach captures both short-term momentum shifts (RSI EMA) and longer-term trend direction (SMA), making it useful across different market phases.
Practical Application
Bullish Setup:
RSI EMA > 50 + Blue SMA → Enter or stay in long positions.
Bearish Setup:
RSI EMA ≤ 50 + White SMA → Exit long positions or consider short opportunities.
This combination of indicators offers traders a balanced strategy that considers both the direction of the trend and the underlying momentum, resulting in more confident and timely decision-making.

Custom RSI & MACD Momentum Entry SignalsIndicator Explanation: Custom RSI & MACD Momentum Entry Signals
Introduction
The "Custom RSI & MACD Momentum Entry Signals" indicator combines the Relative Strength Index (RSI) and the Moving Average Convergence Divergence (MACD) to generate precise long and short entry signals. This indicator offers a powerful combination of overbought/oversold zones, momentum analysis, and RSI-EMA crossovers to assist traders in making better decisions.
How the Indicator Works
1. RSI Calculation and EMA
The RSI is calculated based on the closing price with an adjustable period (default: 14).
An Exponential Moving Average (EMA) of the RSI (default: 9) is plotted to identify RSI trend changes.
When the RSI crosses its EMA upwards, it signals a bullish impulse. Conversely, a downward cross indicates a bearish impulse.
2. MACD Calculation and Momentum Shifts
The MACD line is derived from the difference between a fast EMA (default: 12) and a slow EMA (default: 26).
The Signal line is the EMA of the MACD line (default: 9).
The MACD histogram represents the difference between the MACD line and the Signal line.
Momentum shifts are detected as follows:
Weakening Bearish: Histogram is negative but increasing (less bearish pressure).
Strengthening Bullish: Histogram is positive and rising.
Weakening Bullish: Histogram is positive but decreasing.
Strengthening Bearish: Histogram is negative and falling.
Signal Generation
Long Signals
A Long signal is triggered when all of the following conditions are met:
The RSI was previously below 30 (oversold condition).
MACD momentum shifts from "strengthening bearish" to "weakening bearish" or turns bullish.
The RSI crosses its EMA upwards.
A green upward arrow is displayed below the bar, and the background is lightly shaded green for additional visualization.
Short Signals
A Short signal is triggered when all of the following conditions are met:
The RSI was previously above 70 (overbought condition).
MACD momentum shifts from "strengthening bullish" to "weakening bullish" or turns bearish.
The RSI crosses its EMA downwards.
A red downward arrow is displayed above the bar, and the background is lightly shaded red for additional visualization.
Visual Elements
RSI and EMA:
The RSI is shown in purple.
The RSI EMA is shown in blue.
Horizontal lines at 30 (oversold) and 70 (overbought) provide additional context.
MACD:
The MACD line is displayed in blue.
The Signal line is displayed in orange.
The zero line is added for easier interpretation.
Signals:
Green arrows: Long signals.
Red arrows: Short signals.
Background color: Light green for long conditions, light red for short conditions.
Use Cases
This indicator is ideal for:
Trend Followers: Combining RSI and MACD allows traders to identify entry points during impulsive trend shifts.
Swing Traders: Long and short signals can be used at reversal points to capture short-term price movements.
Momentum Traders: By considering MACD momentum, the indicator provides additional confidence in signal generation.
Customizable Settings
The indicator provides flexible input options:
RSI Period (default: 14)
RSI EMA Period (default: 9)
MACD Parameters: Fast, slow, and signal EMAs can be adjusted.
Conclusion
The Custom RSI & MACD Momentum Entry Signals indicator is a powerful tool for traders looking to combine RSI and MACD to identify high-probability entry signals. With clear visualization and precise signal generation, traders can make decisions more efficiently and capitalize on market movements.

3 Confirmation BearThe "3 Confirmation Bear" indicator is designed to help traders identify strong bearish market conditions with three key confirmations:
Price Below EMA15:
The price trading below the 15-period Exponential Moving Average (EMA) signals bearish momentum.
RSI Below a Threshold:
The Relative Strength Index (RSI) is below a user-defined threshold (default: 50), confirming a lack of bullish strength and momentum favoring the downside.
Downtrend Confirmation:
The indicator ensures the market is in a downtrend by checking for lower highs and lower lows over a specified lookback period.
Key Features:
Bearish Signals: Displays a red downward-pointing label above the price bar when all three conditions are met, making bearish setups easy to identify.
Customizable Inputs: Traders can adjust the EMA length, RSI threshold, and downtrend lookback period to suit their specific strategies.
Versatile Application: Ideal for short entries, trend validation, or avoiding long trades during bearish conditions.
How to Use:
Use the "3 Confirmation Bear" indicator to:
Confirm Short Trades: Enter bearish trades when the signal aligns with your strategy.
Validate Trends: Ensure a clear downtrend is present before committing to a position.
Filter Trades: Avoid long positions during bearish momentum.
This indicator simplifies decision-making by focusing on high-probability bearish setups. Perfect for day traders, swing traders, and those seeking clear confirmation before entering a trade.

Ultimate Machine Learning RSI (Deep Learning Edition)This script represents an advanced implementation of a Machine Learning-based Relative Strength Index (RSI) indicator in Pine Script, incorporating several sophisticated techniques to create a more adaptive, intelligent, and responsive RSI.
Key Components and Features:
Lookback Period: The period over which the indicator "learns" from past data, set to 1000 bars by default.
Momentum and Volatility Weighting: These factors control how much the momentum and volatility of the market influence the learning and signal generation.
RSI Length Range: The minimum and maximum values for the RSI length, allowing the algorithm to adjust the RSI length dynamically.
Learning Rate: Controls how quickly the system adapts to new data. An adaptive learning rate can change based on market volatility.
Memory Factor: Influences how much the system "remembers" previous performance when making adjustments.
Monte Carlo Simulations: Used for probabilistic modeling to create a more robust signal.
\
Price Change: Tracks the difference between the current close and the previous close.
Momentum: A measure of the rate of change in the price over the lookback period.
Volatility: Calculated using the standard deviation of the close prices.
ATR (Average True Range): Tracks the volatility of the market over a short period to influence decisions.
Monte Carlo Simulation:
Probabilistic Signal: This uses multiple random simulations (Monte Carlo) to generate potential future signals. These simulations are weighted by the momentum and volatility of the market. A cluster factor further enhances the simulation based on volatility regimes.
Z-Score for Extreme Conditions:
Z-Score: Measures how extreme current price movements are compared to the historical average, providing context for identifying overbought and oversold conditions.
Dynamic Learning Rate:
The learning rate adjusts based on the volatility of the market, becoming more responsive in high-volatility periods and slower in low-volatility markets. This prevents the system from overreacting to noise but ensures responsiveness to significant shifts.
Recursive Learning and Feedback:
Error Calculation: The system calculates the difference between the true RSI and the predicted RSI, creating an error that is fed back into the system to adjust the RSI length and other parameters dynamically.
RSI Length Adjustment: Based on the error, the RSI length is adjusted, ensuring that the system evolves over time to better reflect market conditions.
Adaptive Smoothing:
In periods of high volatility, the indicator applies a Triple Exponential Moving Average (TEMA) for faster adaptation, while in quieter markets, it uses an Exponential Moving Average (EMA) for smoother adjustments.
Recursive Memory Feedback:
The system maintains a memory of past RSI values, which helps refine the output further. The memory factor influences how much weight is given to past performance versus the current adaptive signal.
Volatility-Based Reinforcement: Higher market volatility increases the impact of this memory feedback, making the model more reactive in volatile conditions.
Multi-Factor Dynamic Thresholds:
Dynamic Overbought/Oversold: Instead of fixed RSI levels (70/30), the thresholds adjust dynamically based on the Z-Score, making the system more sensitive to extreme market conditions.
Combined Multi-Factor Signal:
The final output signal is the result of combining the true RSI, adaptive RSI, and the probabilistic signal generated from the Monte Carlo simulations. This creates a robust, multi-factor signal that incorporates various market conditions and machine learning techniques.
Visual Representation:
The final combined signal is plotted in blue on the chart, along with reference lines at 55 (overbought), 10 (oversold), and 35 (neutral).
Alerts are set up to trigger when the combined signal crosses above the dynamic overbought level or below the dynamic oversold level.
Conclusion:
This "Ultimate Machine Learning RSI" script leverages multiple machine learning techniques—probabilistic modeling, adaptive learning, recursive feedback, and dynamic thresholds—to create an advanced, highly responsive RSI indicator. The result is an RSI that continuously learns from market conditions, adjusts itself in real-time, and provides a more nuanced and robust signal compared to traditional fixed-length RSI. This indicator pushes the boundaries of what's possible with Pine Script and introduces cutting-edge techniques for technical analysis.

ATR Adjusted RSIATR Adjusted RSI Indicator
By Nathan Farmer
The ATR Adjusted RSI Indicator is a versatile indicator designed primarily for trend-following strategies, while also offering configurations for overbought/oversold (OB/OS) signals, making it suitable for mean-reversion setups. This tool combines the classic Relative Strength Index (RSI) with a unique Average True Range (ATR)-based smoothing mechanism, allowing traders to adjust their RSI signals according to market volatility for more reliable entries and exits.
Key Features:
ATR Weighted RSI:
At the core of this indicator is the ATR-adjusted RSI line, where the RSI is smoothed based on volatility (measured by the ATR). When volatility increases, the smoothing effect intensifies, resulting in a more stable and reliable RSI reading. This makes the indicator more responsive to market conditions, which is especially useful in trend-following systems.
Multiple Signal Types:
This indicator offers a variety of signal-generation methods, adaptable to different market environments and trading preferences:
RSI MA Crossovers: Generates signals when the RSI crosses above or below its moving average, with the flexibility to choose between different moving average types (SMA, EMA, WMA, etc.).
Midline Crossovers: Provides trend confirmation when either the RSI or its moving average crosses the 50 midline, signaling potential trend reversals.
ATR-Inversely Weighted RSI Variations: Uses the smoothed, ATR-adjusted RSI for a more refined and responsive trend-following signal. There are variations both for the MA crossover and the midline crossover.
Overbought/Oversold Conditions: Ideal for mean reversion setups, where signals are triggered when the RSI or its moving average crosses over overbought or oversold levels.
Flexible Customization:
With a wide range of customizable options, you can tailor the indicator to fit your personal trading style. Choose from various moving average types for the RSI, modify the ATR smoothing length, and adjust overbought/oversold levels to optimize your signals.
Usage:
While this indicator is primarily designed for trend-following, its OB/OS configurations make it highly effective for mean-reverting setups as well. Depending on your selected signal type, the relevant indicator line will change color between green and red to visually signal long or short opportunities. This flexibility allows traders to switch between trending and sideways market strategies seamlessly.
A Versatile Tool:
The ATR Adjusted RSI Indicator is a valuable component of any trading system, offering enhanced signals that adapt to market volatility. However, it is not recommended to rely on this indicator alone, especially without thorough backtesting. Its performance varies across different assets and timeframes, so it’s essential to experiment with the parameters to ensure consistent results before applying it in live trading.
Recommendation:
Before incorporating this indicator into live trading, backtest it extensively. Given its flexibility and wide range of signal-generation methods, backtesting allows you to optimize the settings for your preferred assets and timeframes. Only consider using it on it's own if you are confident in its performance based on your own backtest results, and even then, it is not recommended.

RSI Multi-Timeframe PINESCRIPTLABS📈 Use the Relative Strength Index (RSI) calculated across multiple time frames to generate signals
🔹 Intraday: Displays a table with real-time RSI values for the time frames of 5 minutes, 15 minutes, 30 minutes, 1 hour, 4 hours, and 1 day.
🔹 Standard: Displays a table with real-time RSI values for the time frames of 30 minutes, 1 hour, 4 hours, 1 day, 1 week, and 1 month.
The indicator allows you to customize overbought and oversold thresholds, as well as choose between viewing RSI values for intraday or standard time frames, tailoring the analysis to your specific needs. 🔧📊
🔔 Signals are generated when in 4 of the 6 time frames we define below:
Overbought Signal (When RSI indicates overbought conditions):
• Intraday: Activated when the RSI in the time frames of 5 minutes, 15 minutes, 30 minutes, and 1 hour is above the 70 threshold. 📈
• Standard: Activated when the RSI in the time frames of 30 minutes, 1 hour, 4 hours, and 1 day is above the 70 threshold. 📈
Oversold Signal (When RSI indicates oversold conditions):
• Intraday: Activated when the RSI in the time frames of 5 minutes, 15 minutes, 30 minutes, and 1 hour is below the 30 threshold. 📉
• Standard: Activated when the RSI in the time frames of 30 minutes, 1 hour, 4 hours, and 1 day is below the 30 threshold. 📉
Español:
📈 Utiliza el Índice de Fuerza Relativa (RSI) calculado en varios marcos de tiempo para generar señales
🔹 Intraday: Muestra una tabla con los valores del RSI en tiempo real para los marcos de tiempo de 5 minutos, 15 minutos, 30 minutos, 1 hora, 4 horas y 1 día.
🔹 Standard: Muestra una tabla con los valores del RSI en tiempo real para los marcos de tiempo de 30 minutos, 1 hora, 4 horas, 1 día, 1 semana y 1 mes.
El indicador te permite personalizar los umbrales de sobrecompra y sobreventa, así como elegir entre ver los valores RSI para marcos de tiempo intradía o estándar, adaptando el análisis a tus necesidades específicas. 🔧📊
🔔 Las señales se generan cuando en 4 de los 6 marcos de tiempo que definimos a continuación:
Señal de Sobrecompra (Cuando el RSI indica sobrecompra):
• Intraday: Se activa cuando el RSI en los marcos de tiempo de 5 minutos, 15 minutos, 30 minutos y 1 hora está por encima del umbral de 70. 📈
• Standard: Se activa cuando el RSI en los marcos de tiempo de 30 minutos, 1 hora, 4 horas y 1 día están por encima del umbral de 70. 📈
Señal de Sobreventa (Cuando el RSI indica sobreventa):
• Intraday: Se activa cuando el RSI en los marcos de tiempo de 5 minutos, 15 minutos, 30 minutos y 1 hora está por debajo del umbral de 30. 📉
• Standard: Se activa cuando el RSI en los marcos de tiempo de 30 minutos, 1 hora, 4 horas y 1 día están por debajo del umbral de 30. 📉

RishiMoney RSIRishiMoney RSI
The "RishiMoney RSI" indicator is designed for traders who want to leverage the power of the Relative Strength Index (RSI) across multiple timeframes.
In addition to regular RSI, this script allows the users to select custom timeframes for two additional RSI calculations, making it easier to identify trends, reversals, and potential entry or exit points.
USAGE
While Returning the same information as a regular RSI the RishiMoney RSI provides two more RSI calculations One for Lagrgest Timeframe and one for middle Timeframe so that the users need not to check for higher timeframes separately Which is very Time consuming. This script solves the problem of time taking process of checking different timeframes RSI calculations.
This script is ideal for traders who want to confirm their analysis across multiple timeframes. By comparing the main RSI with larger and intermediate timeframes, traders can better understand the market's momentum and make more informed decisions.
The RishiMoney RSI crossing above the overbought level can be indicative of a strong uptrend which is highlighted as a green gradient area, while when RishiMoney RSI is crossing under the oversold level can be indicative of a strong downtrend which is highlighted as a red area.
Key Features:
Customizable RSI Period: Set your preferred RSI period for precise calculation and analysis.
Multi-Timeframe RSI:
Largest RSI Timeframe: Choose the largest timeframe for your analysis (Monthly, Weekly, Daily, Hourly, 15 minutes, or 5 minutes).
Middle RSI Timeframe: Select an intermediate timeframe for comparison with the main RSI.
Overbought and Oversold Levels: The indicator includes customizable overbought and oversold levels, which are clearly marked on the chart with dynamic bands.
Alerts: Set up alerts for when the RSI crosses into overbought or oversold territory, so you never miss a potential trading opportunity.
Visual Clarity: The script plots the RSI for your selected timeframes with distinct colors, helping you quickly identify trends across different timeframes.
This script is provided for educational purposes only and should not be considered financial advice. Always conduct your own research and consult with a financial advisor before making any trading decisions.

Stochastic RSI Strategy with Inverted Trend LogicOverview:
The Stochastic RSI Strategy with Inverted Trend Logic is a custom-built Pine Script indicator that leverages the Stochastic RSI and a 200-period moving average to generate precise buy and sell signals. It is specifically designed for traders looking to capture opportunities during short-term market movements while factoring in broader trend conditions.
Key Components:
Stochastic RSI:
Stochastic RSI is a momentum indicator that applies stochastic calculations to the standard Relative Strength Index (RSI), rather than price data. This makes it particularly sensitive to market momentum changes, which is essential for timing entries and exits.
K Line and D Line: The indicator calculates and smooths both the K and D lines to capture momentum shifts more accurately.
200-Period Moving Average:
The 200-period Simple Moving Average (SMA) is used as a trend filter.
If the price is above the 200-period SMA, the trend is considered bullish.
If the price is below the 200-period SMA, the trend is considered bearish.
Inverted Trading Logic:
The trading logic is inverted from traditional strategies:
Long trades are executed only when the market is in a bearish trend (price below the 200-period moving average).
Short trades are executed only when the market is in a bullish trend (price above the 200-period moving average).
This inversion allows traders to take advantage of potential trend reversals by entering positions in the opposite direction of the prevailing trend.
Trading Rules:
Long Trade Conditions (Buy Signal):
The Stochastic RSI K line must be below 5 for 4 consecutive candles (oversold condition).
The price must be below the 200-period SMA (indicating a bearish trend).
Once these conditions are met, the indicator will generate a buy signal on the close of the 4th candle.
Exit Condition: The long position is exited when the Stochastic RSI K line crosses above 50 (neutral level).
Short Trade Conditions (Sell Signal):
The Stochastic RSI K line must be above 95 for 4 consecutive candles (overbought condition).
The price must be above the 200-period SMA (indicating a bullish trend).
Once these conditions are met, the indicator will generate a sell signal on the close of the 4th candle.
Exit Condition: The short position is exited when the Stochastic RSI K line crosses below 50.
Visual Signals on the Chart:
Buy Signal:
A green triangle below the bar is displayed on the chart when a buy condition is met, indicating a potential long trade opportunity.
The text "BUY" is displayed for further clarity.
Sell Signal:
A red triangle above the bar is displayed on the chart when a sell condition is met, indicating a potential short trade opportunity.
The text "SELL" is displayed for further clarity.
How to Use the Indicator:
Attach the Indicator: Apply the indicator to your desired chart (works on any time frame, but is optimized for short- to medium-term trading).
Monitor Signals: Watch for buy and sell signals on the chart:
Buy Signal: Enter long positions when a green triangle appears below the candle.
Sell Signal: Enter short positions when a red triangle appears above the candle.
Exit Positions: Exit long positions when the Stochastic RSI crosses above the 50 level, and exit short positions when the Stochastic RSI crosses below the 50 level.
Indicator Display:
Stochastic RSI: A visual representation of the Stochastic RSI (K and D lines) is plotted below the price chart, with overbought (100), midpoint (50), and oversold (0) levels clearly marked.
200-period SMA: The 200-period moving average is plotted on the price chart, giving a clear indication of the broader trend direction (orange line).
Key Benefits:
Reversal Opportunities: This strategy allows traders to capture reversal trades by using an inverted logic where longs are taken in bearish conditions and shorts are taken in bullish conditions. This can help capitalize on potential trend exhaustion and reversals.
Clear and Simple Rules: The use of Stochastic RSI and the 200-period moving average ensures the strategy remains simple yet effective, making it easy for traders to follow.
Visual Alerts: The indicator provides clear buy and sell signals, making it easy for traders to spot trading opportunities in real-time without needing to monitor multiple conditions manually.
Limitations and Considerations:
Trend Changes: Since the strategy is designed to work during trend reversals, it might not perform as well during strong, prolonged trends where price continues moving in one direction without significant pullbacks.
Time Frame Suitability: While the indicator works on any time frame, shorter time frames may result in more frequent signals and higher trade frequency, whereas higher time frames will provide fewer but potentially stronger signals.
Conclusion:
The Stochastic RSI Strategy with Inverted Trend Logic is a powerful tool for traders looking to capture market reversals by entering trades against the prevailing trend direction based on momentum exhaustion. Its simple and clear logic, combined with easy-to-understand visual signals, makes it a versatile indicator for both novice and experienced traders.

Multi-Length RSI **Multi-Length RSI Indicator**
This script creates a custom Relative Strength Index (RSI) indicator with the ability to plot three different RSI lengths on the same chart, allowing traders to analyze momentum across various timeframes simultaneously. The script also includes features to enhance visual clarity and usability.
**Key Features:**
1. **Customizable RSI Lengths:**
- The script allows you to input and customize three different RSI lengths (7, 14, and 28 by default) via user inputs. This flexibility enables you to track short-term, medium-term, and long-term momentum in the market.
2. **Dynamic Colour Coding:**
- The RSI lines are color-coded based on their current value:
- **Above 70 (Overbought)**: The line turns red.
- **Below 30 (Oversold)**: The line turns green.
- **Between 30 and 70**: The line retains its user-defined colour (blue, yellow, orange by default).
- This dynamic colouring helps to quickly identify overbought and oversold conditions.
3. **Adjustable Line Widths and Colours:**
- Users can customize the colour and thickness of each RSI line, allowing for a personalized visual experience that fits different trading strategies.
4. **Overbought, Oversold, and Midline Levels:**
- The script includes static horizontal lines at the 70 (Overbought) and 30 (Oversold) levels, with a red and green colour, respectively.
- A midline at the 50 level is also included in gray and dashed, helping to visualize the neutral zone.
5. **Dynamic RSI Value Labels:**
- The current values of each RSI line are displayed directly on the chart as labels at the most recent bar, with colours matching their corresponding lines. This feature provides an immediate reference to the exact RSI values without the need to hover or look at the data window.
6. **Alerts for Crosses:**
- The script includes built-in alert conditions for when any of the RSI values cross above the overbought level (70) or below the oversold level (30). These alerts can be configured to notify you in real-time when significant momentum shifts occur.
**How to Use:**
1. **Customization**:
- Input your preferred RSI lengths, colours, and line widths through the script’s settings menu.
2. **Visual Analysis**:
- The indicator plots all three RSI values on a separate pane below the price chart. Use the color-coded lines and levels to quickly identify overbought, oversold, and neutral conditions across multiple timeframes.
3. **Set Alerts**:
- You can configure alerts based on the built-in alert conditions to get notified when the RSI crosses critical levels.
**Ideal For:**
- **Traders looking to analyze momentum across multiple timeframes**: The ability to view short-term, medium-term, and long-term RSIs simultaneously offers a comprehensive view of market strength.
- **Those who prefer visual clarity**: The dynamic colouring, clear labels, and customizable settings make it easy to interpret RSI data at a glance.
- **Traders who rely on alerts**: The built-in alert system allows for proactive trading based on significant RSI level crossings.
---
This script is a powerful tool for any trader looking to leverage RSI analysis across multiple timeframes, offering both customization and clarity in a single indicator.
RSI Divergence and GradientThe RSI Divergence and Gradient Indicator simplifies the process of identifying the relationship between price action and the Relative Strength Index (RSI). By integrating RSI data directly into the price chart, traders no longer need to open a separate pane to monitor RSI or manually compare price action and RSI.
This indicator allows traders to easily spot overbought or oversold conditions and detect divergences between price and RSI. These signals can help identify potential reversal points and more effectively assess trend strength.
Features
RSI Divergences: The script identifies and plots bullish and bearish RSI divergences, which can signal potential reversals. Bullish divergences are indicated by an upward triangle below the price bars, while bearish divergences are indicated by a downward triangle above the price bars.
Overbought/Oversold Gradient: The script uses a color gradient to highlight overbought and oversold conditions on the chart, helping traders visualize momentum and trend strength. The gradient dynamically adjusts based on RSI values, transitioning through different colors to represent the intensity of overbought or oversold conditions.
Customizable Gradient: The gradient is customizable, allowing traders to set their own thresholds for overbought and oversold levels, and to choose the colors that best suit their trading style. This flexibility ensures the indicator can be tailored to individual preferences.
How It Works
RSI Calculation: The indicator calculates RSI using the standard 14-period length by default, but this can be adjusted to suit the trader's needs.
Divergence Detection: The script identifies divergences by comparing the highest and lowest points of the RSI with the corresponding price levels over the RSI period length. When a divergence is detected, it is plotted on the chart to indicate a potential reversal.
Gradient Coloring: The gradient coloring system changes the bar colors based on RSI levels. The color transitions from a neutral tone to specified start and end colors as RSI approaches overbought or oversold thresholds, providing a visual cue for potential overextended market conditions.
Intended Use
This indicator is particularly useful for traders who want to combine momentum analysis with divergence signals to identify potential reversal points or confirm trend strength. The visual gradient aids in quickly assessing market conditions, making it easier to spot high-probability trading opportunities.

TechniTrend RSI (11TF)Multi-Timeframe RSI Indicator
Overview
The Multi-Timeframe RSI Indicator is a sophisticated tool designed to provide comprehensive insights into the Relative Strength Index (RSI) across 11 different timeframes simultaneously. This indicator is essential for traders who wish to monitor RSI trends and their moving averages (MA) to make informed trading decisions.
Features
Multiple Timeframes: Displays RSI and RSI MA values for 11 different timeframes, allowing traders to have a holistic view of the market conditions.
RSI vs. MA Comparison: Indicates whether the RSI value is above or below its moving average for each timeframe, helping traders to identify bullish or bearish momentum.
Overbought/Oversold Signals:
Marks "OS" (OverSell) when RSI falls below 25, indicating a potential oversold condition.
Marks "OB" (OverBuy) when RSI exceeds 75, signaling a potential overbought condition.
Real-Time Updates: Continuously updates in real-time to provide the most current market information.
Usage
This indicator is invaluable for traders who utilize RSI as part of their technical analysis strategy. By monitoring multiple timeframes, traders can:
Identify key overbought and oversold levels to make entry and exit decisions.
Observe the momentum shifts indicated by RSI crossing above or below its moving average.
Enhance their trading strategy by integrating multi-timeframe analysis for better accuracy and confirmation.
How to Interpret the Indicator
RSI Above MA: Indicates a potential bullish trend. Traders may consider looking for long positions.
RSI Below MA: Suggests a potential bearish trend. Traders may look for short positions.
OS (OverSell): When RSI < 25, the market may be oversold, presenting potential buying opportunities.
OB (OverBuy): When RSI > 75, the market may be overbought, indicating potential selling opportunities.
